
by Nathan Wiggin, VP of Consumer Insights and Solutions
Across the country, cities are growing more diverse—racially, ethnically, linguistically, and socioeconomically. These shifts reflect broader global trends, and they bring new urgency to how local governments engage with their communities.
More and more, local governments are recognizing that community surveys must reflect the voices of all residents, not just the most reachable. But achieving a truly representative sample, especially among immigrants, non-English speakers, and historically underrepresented groups, remains a persistent challenge.
Over the past fifteen years, our team has been working to meet that challenge head-on. We’ve tested new strategies, learned from missteps, and worked steadily to close the gap between who lives in our cities and who shows up in our data. It’s been messy, eye-opening, and ultimately, transformative.
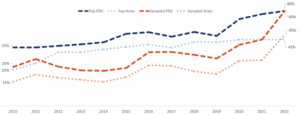
One of the clearest markers of progress has been the alignment between Bellevue’s actual population and those who participate in our surveys. A decade ago, these lines didn’t match. But with a lot of experimentation—and persistence—they’re now closer than ever.
Figure 1: Closing the Gap—Survey Representation vs. Bellevue’s Racial Demographics (2010–2022)
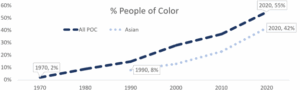
What follows is a behind-the-scenes look at that journey—a deep dive into one community, Bellevue, WA, and the steps we’ve taken over the past 15 years to make our surveys more inclusive. The city has transformed significantly in recent decades, with people of color—and Asian Americans in particular—making up a growing share of the population.
Figure 2: Growth of Racial Diversity in Bellevue, WA (1970–2020)
The Introduction of Address-Based Sample and Multi-Lingual Accessibility
Our meta-analysis begins in 2010, the year we made a foundational shift—from random digit dialing (RDD) to address-based sampling. In 2016, we expanded further by adding a cell phone frame to our sampling approach, which gave us an unexpected boost in reaching newer immigrants and lower-income households—communities more likely to rely on mobile phones than landlines.
Then, in 2017, came a long-overdue step: we translated the survey. For years, it was offered only in English, despite the city’s growing diversity. So why did it take so long? In short—cost and bureaucracy. Translation isn’t cheap. And while vital for equitable access, simply offering a survey in multiple languages doesn’t guarantee higher participation. This isn’t Field of Dreams—you can build it, and they still might not come.
Figure 3: Trends in Cost and Completions for Non-English Surveys in Bellevue (2017–2022)
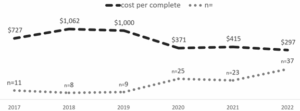
As above the figure shows, early translation efforts were costly and yielded low response rates. But over the past several years, we’ve greatly expanded the number of languages while steadily driving costs down. And while we’re not exactly “raking in the respondents,” we’ve committed to continuing this practice—and to expanding our linguistic reach even further.
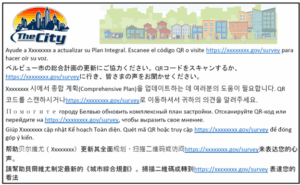
Looking ahead, we’re exploring smarter ways to be more inclusive while being mindful of translation costs. One of the strategies we’re piloting is presumed language targeting—pairing surname data with neighborhood demographics to predict a household’s likely language and tailoring survey invitations accordingly. For instance, if a household with a Chinese surname lives in a historically Chinese-speaking neighborhood, they might receive a postcard in Chinese first, with English as a secondary fallback.
Figure 4: Multilingual Survey Invitation Mailed to Bellevue Residents
We’re also exploring real-time multilingual phone support—so residents can speak with an interviewer in their preferred language instantly, without being put on hold while we search for a match. We’re not there yet, but we’re actively learning, adapting, and building toward that future.
Meeting People Where They Are: From Community Events to Trusted Messengers
Between 2018 and 2020, we added two small but mighty changes to our approach, neither of which required new infrastructure or tools, just a shift in mindset.
The first solution came partly from within the city—we realized staff were already attending community events at local parks, resource centers, and markets. So, we equipped them to promote the survey on-site. These informal, face-to-face invites helped demystify the process and reinforce that the city truly wants to hear from everyone.
Second, we began working closely with community-based organizations (CBOs)—trusted messengers already embedded in neighborhoods. They helped amplify survey participation in ways we could not.
Oversampling With Intention
One of our most promising shifts came when we began combining address-based sample data with publicly available demographic data from the U.S. Census and American Community Survey. In 2022, we collaborated with the Bellevue’s demographer to identify neighborhoods and census block groups that contained higher proportions of historically underrepresented voices—particularly immigrants, Asian Americans, and nonwhite residents.
Figure 5: Census-Based Racial Majority Mapping to Support Targeted Outreach in Bellevue
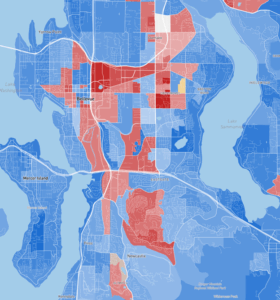
The map above illustrates how we used racial self-identification data from the Census to visualize demographic patterns across Bellevue’s neighborhoods. It helped us prioritize areas for oversampling—allowing us to better focus on our outreach.
This strategy yielded the most representative results we’d seen yet. We successfully aligned our sample with Bellevue’s racial makeup overall. But it wasn’t perfect. We later realized that our oversample skewed toward higher-income Asian households—think tech professionals, dual-income earners, and Microsoft executives. A strong step forward, but still only one slice of the community.
We are continually refining our targeting approach. We have recently expanded beyond race to include income, housing status, language, education level, and other key indicators. We’re not just looking for demographic parity—we’re looking to reflect the full heterogeneity of the population.
Lessons Learned (and Still Learning)
If there’s one thing this journey has taught me, it’s that there’s no silver bullet. Every time we thought we’d nailed the solution, we found something new to improve. That’s the nature of meaningful public engagement: it’s messy, iterative, and always evolving.
We are continuing to experiment and celebrating our successes. For example, we recently ran a pilot in King County using in-language outreach (Spanish first), and it worked beautifully, and has given us the confidence to try this approach again. These moments don’t just validate our strategies—they point the way forward.
So here are a few takeaways I carry forward:
- Acknowledge the problem. Representation gaps don’t close themselves.
- Start somewhere. Even imperfect steps move you forward.
- Iterate constantly. Try, test, adjust, repeat.
- Temper your promises. Set expectations grounded in learning, not perfection.
- Don't fear failure. The best hitters in baseball miss more than they hit—progress comes from stepping up to the plate again and again.
For more information on ReconMR’s survey work, and how our team can help improve your surveys, contact us today to set up a consultation.
Browse by Category
Browse by Date